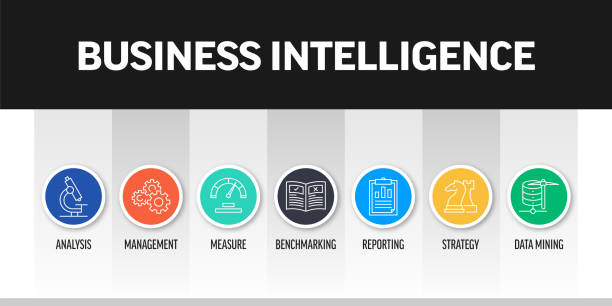
1. What Are Business Intelligence Exercises?
Business intelligence (BI) exercises are hands-on activities designed to improve data analysis, visualization, and decision-making skills. These exercises simulate real-world scenarios where users gather, interpret, and act on data using BI tools like Power BI, Tableau, or Excel. They are often used in training programs, academic courses, or corporate workshops.
By engaging in these exercises, professionals can strengthen their ability to convert raw data into actionable insights. The focus is not just on technical tool use but also on understanding trends, patterns, and key performance indicators (KPIs) that drive smarter business decisions.
2. Data Cleaning and Preparation Drills
One of the foundational BI exercises involves cleaning and preparing datasets for analysis. Participants are given messy, inconsistent data that needs to be corrected, standardized, and formatted properly. This task helps reinforce skills like data validation, null handling, and data transformation.
Clean data is essential for reliable insights. These drills highlight how even the most advanced dashboards can fail if the underlying data isn’t accurate. Practicing data prep ensures users can build trustworthy reports and make data-driven decisions with confidence.
3. Dashboard Creation Using BI Tools
Creating a dashboard is a core business intelligence exercise that teaches data visualization and storytelling. Participants are asked to present KPIs, trends, or forecasts using charts, graphs, and filters. Tools like Power BI or Tableau are commonly used to complete these tasks.
This type of exercise emphasizes clarity and usability, challenging users to design interfaces that are visually appealing and easy to navigate. A well-designed dashboard allows stakeholders to quickly understand the story behind the numbers, making it a critical skill for any BI professional.
4. KPI Analysis and Performance Tracking
In this exercise, users select and analyze key performance indicators relevant to a specific business goal. For example, participants may track sales conversion rates, customer retention, or operational efficiency. The task includes identifying trends and suggesting actionable recommendations.
Understanding how to measure success through KPIs is central to business intelligence. These exercises teach users how to align data analysis with strategic objectives, ensuring that insights lead to tangible improvements across departments.
5. Forecasting and Trend Analysis
Forecasting exercises challenge users to project future performance based on historical data. This might include predicting revenue for the next quarter or estimating customer churn. Statistical tools and BI software are used to identify patterns and build predictive models.
These exercises strengthen the analytical mindset needed to anticipate change and reduce uncertainty in business planning. By mastering forecasting techniques, professionals can help organizations stay agile and proactive in a competitive marketplace.
6. Competitor Analysis Using Public Data
A valuable BI exercise involves analyzing competitor performance using publicly available data. Participants may pull financial statements, website metrics, or industry reports to compare benchmarks and identify market positioning.
This practice hones skills in data sourcing, comparative analysis, and strategic thinking. It helps users see beyond internal performance and understand how their company stacks up against others in the same space, offering insights that can drive innovation and growth.
7. Real-Time Data Monitoring Exercises
These exercises focus on creating dashboards or alerts that track live business operations, such as website traffic or inventory levels. Participants work with APIs, streaming data, or direct connections to databases to build real-time monitoring tools.
Real-time BI is essential for dynamic decision-making. Practicing with live data trains users to identify and respond to changes as they happen, minimizing delays and maximizing responsiveness in fast-paced environments like retail or logistics.
8. Building Custom Reports for Stakeholders
Another core BI exercise involves tailoring reports for different stakeholder needs. Participants are given multiple user personas (e.g., marketing manager, CEO, financial analyst) and tasked with designing reports that cater to each audience’s priorities.
This activity sharpens communication skills and emphasizes the importance of context in data reporting. A great BI professional knows that raw data isn’t enough—reports must speak clearly and directly to the people using them to make decisions.
9. Exploring Data Warehousing Concepts
This advanced exercise introduces users to data warehousing and ETL (Extract, Transform, Load) processes. Participants simulate data movement from multiple sources into a centralized warehouse, optimizing it for reporting and analysis.
Understanding how data is structured and stored behind the scenes is vital for accurate BI. This type of exercise equips users to manage larger datasets, reduce redundancy, and maintain consistency across all business intelligence platforms.
10. Scenario-Based Decision-Making with BI Tools
In this comprehensive exercise, users are presented with a fictional business challenge—such as declining sales or rising costs—and asked to use BI tools to diagnose the issue and propose solutions. They must collect data, build reports, and present a strategy to stakeholders.
This scenario-based approach encourages critical thinking, collaboration, and presentation skills. It brings all BI elements together, simulating the real-world environment where data is just one part of making informed and effective decisions.


